Our log / Article

Introduction to H3

H3 reimagines how we understand and organize location data through a global grid of hexagons. This article reveals five surprising insights: why hexagons make better neighbors than squares, why a flawless grid requires subtle imperfections, and how this elegant system now powers diverse real-world applications beyond ride-hailing.

image of Víctor Centelles
Víctor Centelles
Software Architect
December 5th, 2025

    Introduction

    You open an app on your phone. Maybe you’re checking how far away your ride-share is, or perhaps you’re seeing which restaurants deliver to your area. On the surface, it’s just a map with a few moving dots or shaded regions. But behind this simple interface lies a monumental challenge: how do companies like Uber process, analyze, and make decisions based on billions of location data points in real time? The answer isn’t just about more powerful computers; it’s about more innovative geometry.

    The challenge of efficiently managing massive spatial datasets led Uber to develop and open-source a revolutionary solution called H3. It’s a global grid system that divides the entire planet not into familiar squares, but into a seamless honeycomb of hexagons. The choice of this simple shape is the first clue in a story of elegant compromises and clever solutions to monumental data challenges.

    This article uncovers five counterintuitive and powerful truths about the H3 system. You'll learn why hexagons are better neighbors than squares, why a perfect grid requires a few imperfections, and how this elegant system is being used for far more than just hailing a ride.

    Full view

    For mapping, hexagons beat squares

    Hexagons have better neighbors

    We are all intuitively familiar with square grids. They are the foundation of pixels on our screens and the grid lines on city maps. When we think of dividing up a space, squares are often the first shape that comes to mind.

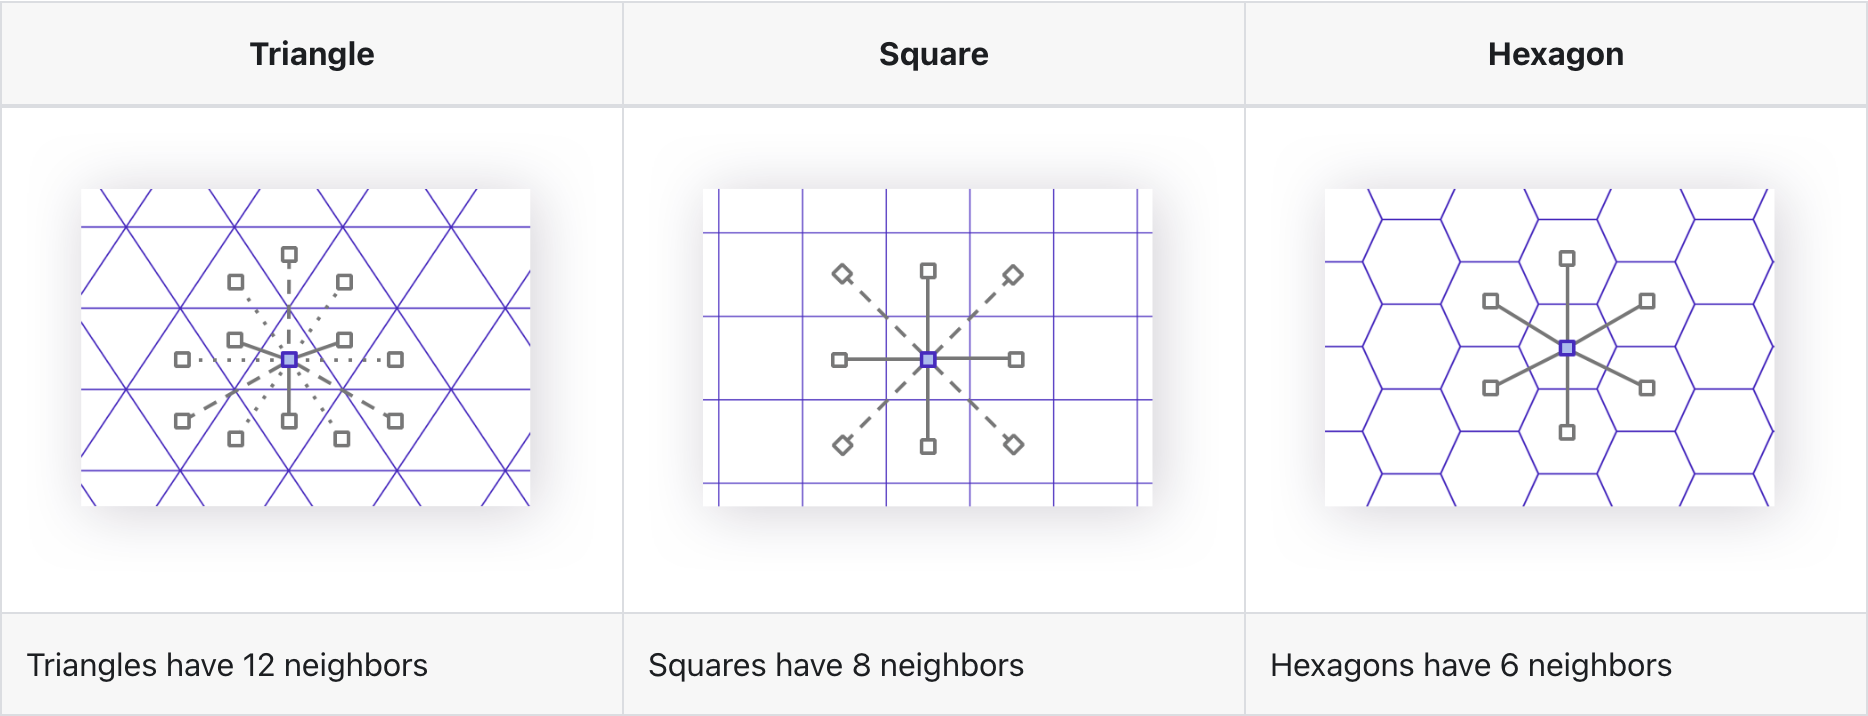
    However, for analyzing movement and proximity, squares have a significant flaw. A square cell has eight neighbors, but they aren't all created equal. The four neighbors at the cardinal directions (north, south, east, west) are closer to the center than the four neighbors on the diagonals. This difference in distance complicates algorithms that need to find the "nearest" of anything.

    In contrast, a hexagon's geometry provides a key advantage: all six of its neighbors are equidistant from its center. This uniformity is a brilliant solution that dramatically simplifies spatial analysis. This geometric purity enables a range of algorithms and optimizations based on the grid, including nearest neighbors, shortest path, and gradient smoothing, making it vastly more efficient to find the closest driver or model how a phenomenon spreads across an area.

    Full view

    The earth can't be tiled perfectly with hexagons

    The perfect grid has a few imperfections

    Here’s a surprising geometric fact: it is mathematically impossible to perfectly cover a sphere, like the Earth, using only hexagons. Any attempt to do so will result in gaps or overlaps. This is where H3’s design philosophy of intelligent trade-offs becomes clear.

    To solve this, H3 makes a clever compromise. The global grid is composed almost entirely of hexagons, but it also includes exactly 12 pentagons at every resolution level. This small, fixed number of five-sided cells allows the grid to conform to the planet's spherical shape without leaving any gaps.

    As a brilliant engineering move, the system has cleverly placed those pentagons far away from any landmasses, so this is only a practical concern for specific maritime operations. For the vast majority of land-based applications, you will never encounter one. This is a perfect example of H3’s core principle: a small, controlled imperfection enables a vastly powerful and practical global system.

    Full view

    The hierarchy isn't perfect (and that's okay)

    The "Hierarchical" layers don't nest perfectly

    H3 is a hierarchical system, which means the grid exists at 16 different levels of resolution (from 0 to 15). At its coarsest level, a single hexagon can cover a massive portion of a continent. At its finest level, a hexagon is only about one square meter in area. This hierarchical structure enables analysts to transition seamlessly from analyzing patterns across a handful of continent-spanning cells at Resolution 0 to the trillions of cells required to cover the globe at the hyper-precise Resolution 15.

    However, another counterintuitive detail is that the hexagons at finer resolutions do not nest exactly inside the coarser parent hexagon above them. When you move between different scales, there are tiny discontinuities—small gaps or overlaps—between the parent and child cells.

    This is a classic engineering decision where sacrificing absolute geometric purity unlocks orders-of-magnitude performance gains. For applications requiring absolute precision, this could be a limitation. However, for the vast majority of large-scale data analysis, this slight loss of precision is a worthwhile and intelligent trade-off for the immense speed the system provides.

    Full view

    It turns complex geography into a simple number

    Every location on earth becomes a single, simple ID

    The core function of H3 is to convert any geographic coordinate (latitude and longitude) into a single, compact 64-bit integer that serves as a unique ID for that hexagon. For example, the coordinates for the Statue of Liberty can be converted into the H3 index 8a2a1072b59ffff at resolution 10.

    article image

    Coordinates for the Statue of Liberty converted into H3 index (resolution 10).

    Full view

    This conversion of geometry to integers is H3's most transformative feature. Computers are incredibly fast at processing simple numbers but are much slower when working with complex geometric shapes like polygons. By converting every location into a simple integer, H3 transforms complex spatial problems into high-speed numerical ones.

    This is particularly advantageous for modern analytics, enabling GPU-accelerated workflows where massive parallel processing of simple integers delivers results dramatically faster than traditional geometric operations. Instead of performing slow spatial calculations, the system can simply join, filter, and aggregate these simple IDs with incredible efficiency.

    Full view

    It's powering more than just ride-sharing

    It's not just for finding your next ride

    While H3 was born from Uber's need to optimize ride-sharing logistics, such as driver dispatch and dynamic pricing, its utility extends far beyond that. As an open-source tool, it has been widely adopted across various industries for a diverse range of geospatial analysis tasks, solidifying its role as a fundamental tool for the entire geospatial community.

    Here are just a few real-world examples of its diverse applications:

    • Taxi Distribution (NYC): The analysis focuses on the operational balance. It colors hexagons based on the ratio of pickups to drop-offs (green for more pickups, orange for fewer)
    • Visualizing Air Quality: Mapping NO2 concentration levels across London by visualizing a grid of over 1.2 million cells, providing hyper-local insights into pollution patterns.
    • Optimizing Supply Chains: Companies can utilize H3 to evaluate potential business acquisitions by analyzing their proximity to stable feedstock supplies and ranking opportunities based on multiple geographic criteria.

    From urban planning to environmental science, H3 has evolved into a versatile and powerful tool for anyone working with large-scale geospatial data.

    Full view

    Conclusion: a new way of seeing the world

    The elegance of Uber's H3 system lies in its series of brilliant compromises. It accepts tiny, controlled imperfections—a handful of pentagons and slight nesting inaccuracies—to create a system that is overwhelmingly efficient, scalable, and easy to use. Abstracting the immense complexity of global geography into a simple grid of hexagons, each with a unique ID, provides a robust new framework for understanding spatial relationships.

    Its open-source nature has been the key to its widespread adoption, transforming it from an internal corporate tool into a foundational piece of technology for data scientists and developers everywhere. H3 gives us a fundamentally different way to interact with location data. Now that we know the world can be viewed as a grid of hexagons, what other complex spatial patterns could we uncover?

    Full view